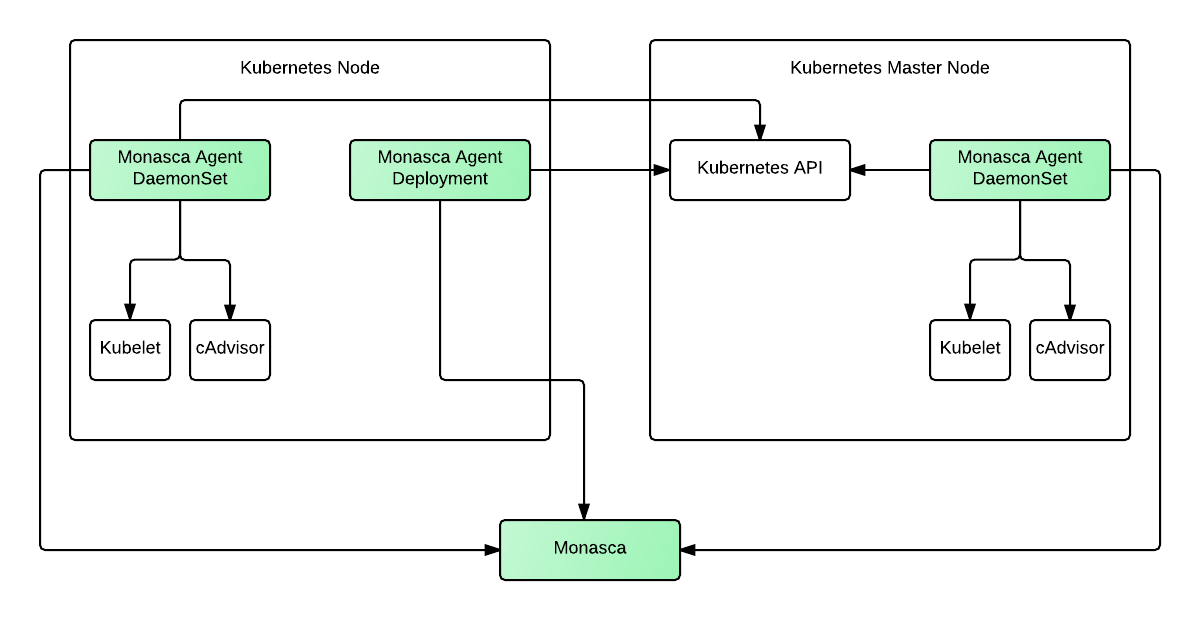

Monasca can be deployed into Kubernetes to monitor containers, services and Kubernetes itself.
A deamonset/deployment of the monasca-agent will be brought up when deploying Monasca into Kubernetes. The daemonset will monitor pod/node workloads and the deployment will monitor Kubernetes status/health. They both do autodetection on Prometheus endpoints to scrape metrics from and send into the Monasca pipeline.

The Daemonset monasca-agent runs on every node in the cluster and collects metrics on pod/node workloads and autodetects prometheus endpoints on pods.
Pod monitoring is accomplished by first querying Kubelet on each node to grab all running pods and their associated metadata and then querying cAdvisor for container usage (memory, cpu, network, etc.). The agent then correlates the container data from cAdvisor to the running pods to report usage metrics on each pod (container data is aggregated up to the pod level).
The agent can be configured to report container metrics on top of the pod metrics if desired.
More information on the metrics we are collecting for pods can be seen in the plugin’s documentation
Node monitoring is accomplish by querying cAdvisor for the nodes usage metrics. The complete metric list can be found in the plugin’s documentation
The monasca agent on each node will autodetect Prometheus endpoints to scrape metrics from by querying the Kubelet for each running pod and looking at their annotations.
These annotations being:
If the pod contains the scrape annotation the agent will attempt to scrape metrics from it and send through Monasca.
The Deployment monasca-agent collects metrics on the Kubernetes cluster and autodetects prometheus endpoints on services.
The monasca agent queries the Kubernetes API for metrics such as component health, replica counts (on deployments/replicaton controllers), host status flags.
The full list of the metrics being collected can be seen in the plugin’s documentation
The monasca agent queries the Kubernetes API for services and then looks at the annotations correlated with each service to determine to scrape or not.
These annotations being:
If the service contains the scrape annotation the agent will attempt to scrape metrics from it to send through Monasca.